Culture
Massive freehand map of North America
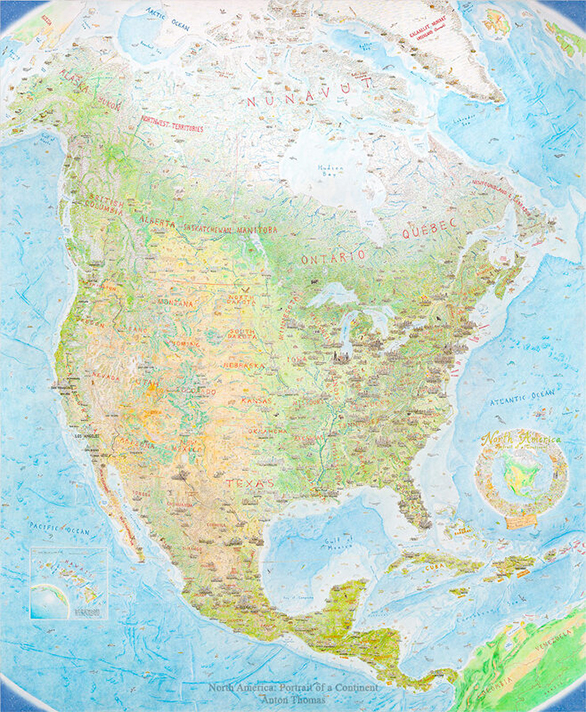
There are nearly 10 million square miles within the borders of North America. In addition, the continent is bordered by roughly 40,000 miles of coastline. Within the North American continent, there are many forests, mountain ranges, deserts, and prairies. The amount of detail is hard to comprehend and the magnitude of depth is unimaginable. However, for close to five years cartographer Anton Thomas drew North American by hand.
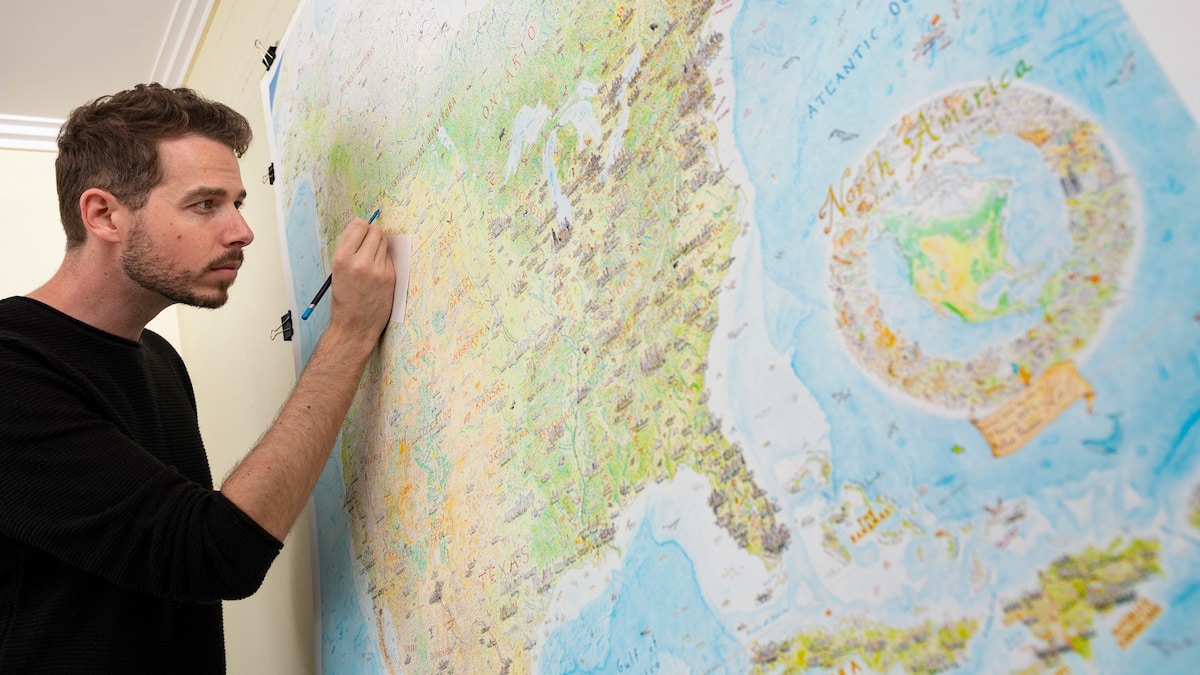
Thomas freehand drawing…
Image courtesy of: My Modern Met
The Melbourne-based artist drew North America using only a pen and 24 colored pencils. He averaged 5,000-square- miles per day… thus, it took Thomas four years and nine months to complete the masterpiece. The final project, completed in February 2019, spans 20 square-feet.
Thomas began drawing maps as a child and then he took a 20 year break from his hobby. He began drawing maps again when he was living in Montreal and working as a cook. The apartment he rented had a big fridge that had been found on the side of the road, it was rusty with brown stains all over. Since he was getting ready to go back to Australia, Thomas’ roommate asked him to draw something as a memento. He started with British Columbia and once he got to Vancouver, he thought “It would be pretty cool to draw the Vancouver skyline.” Soon, he got to Seattle and Portland… then San Francisco and onward.
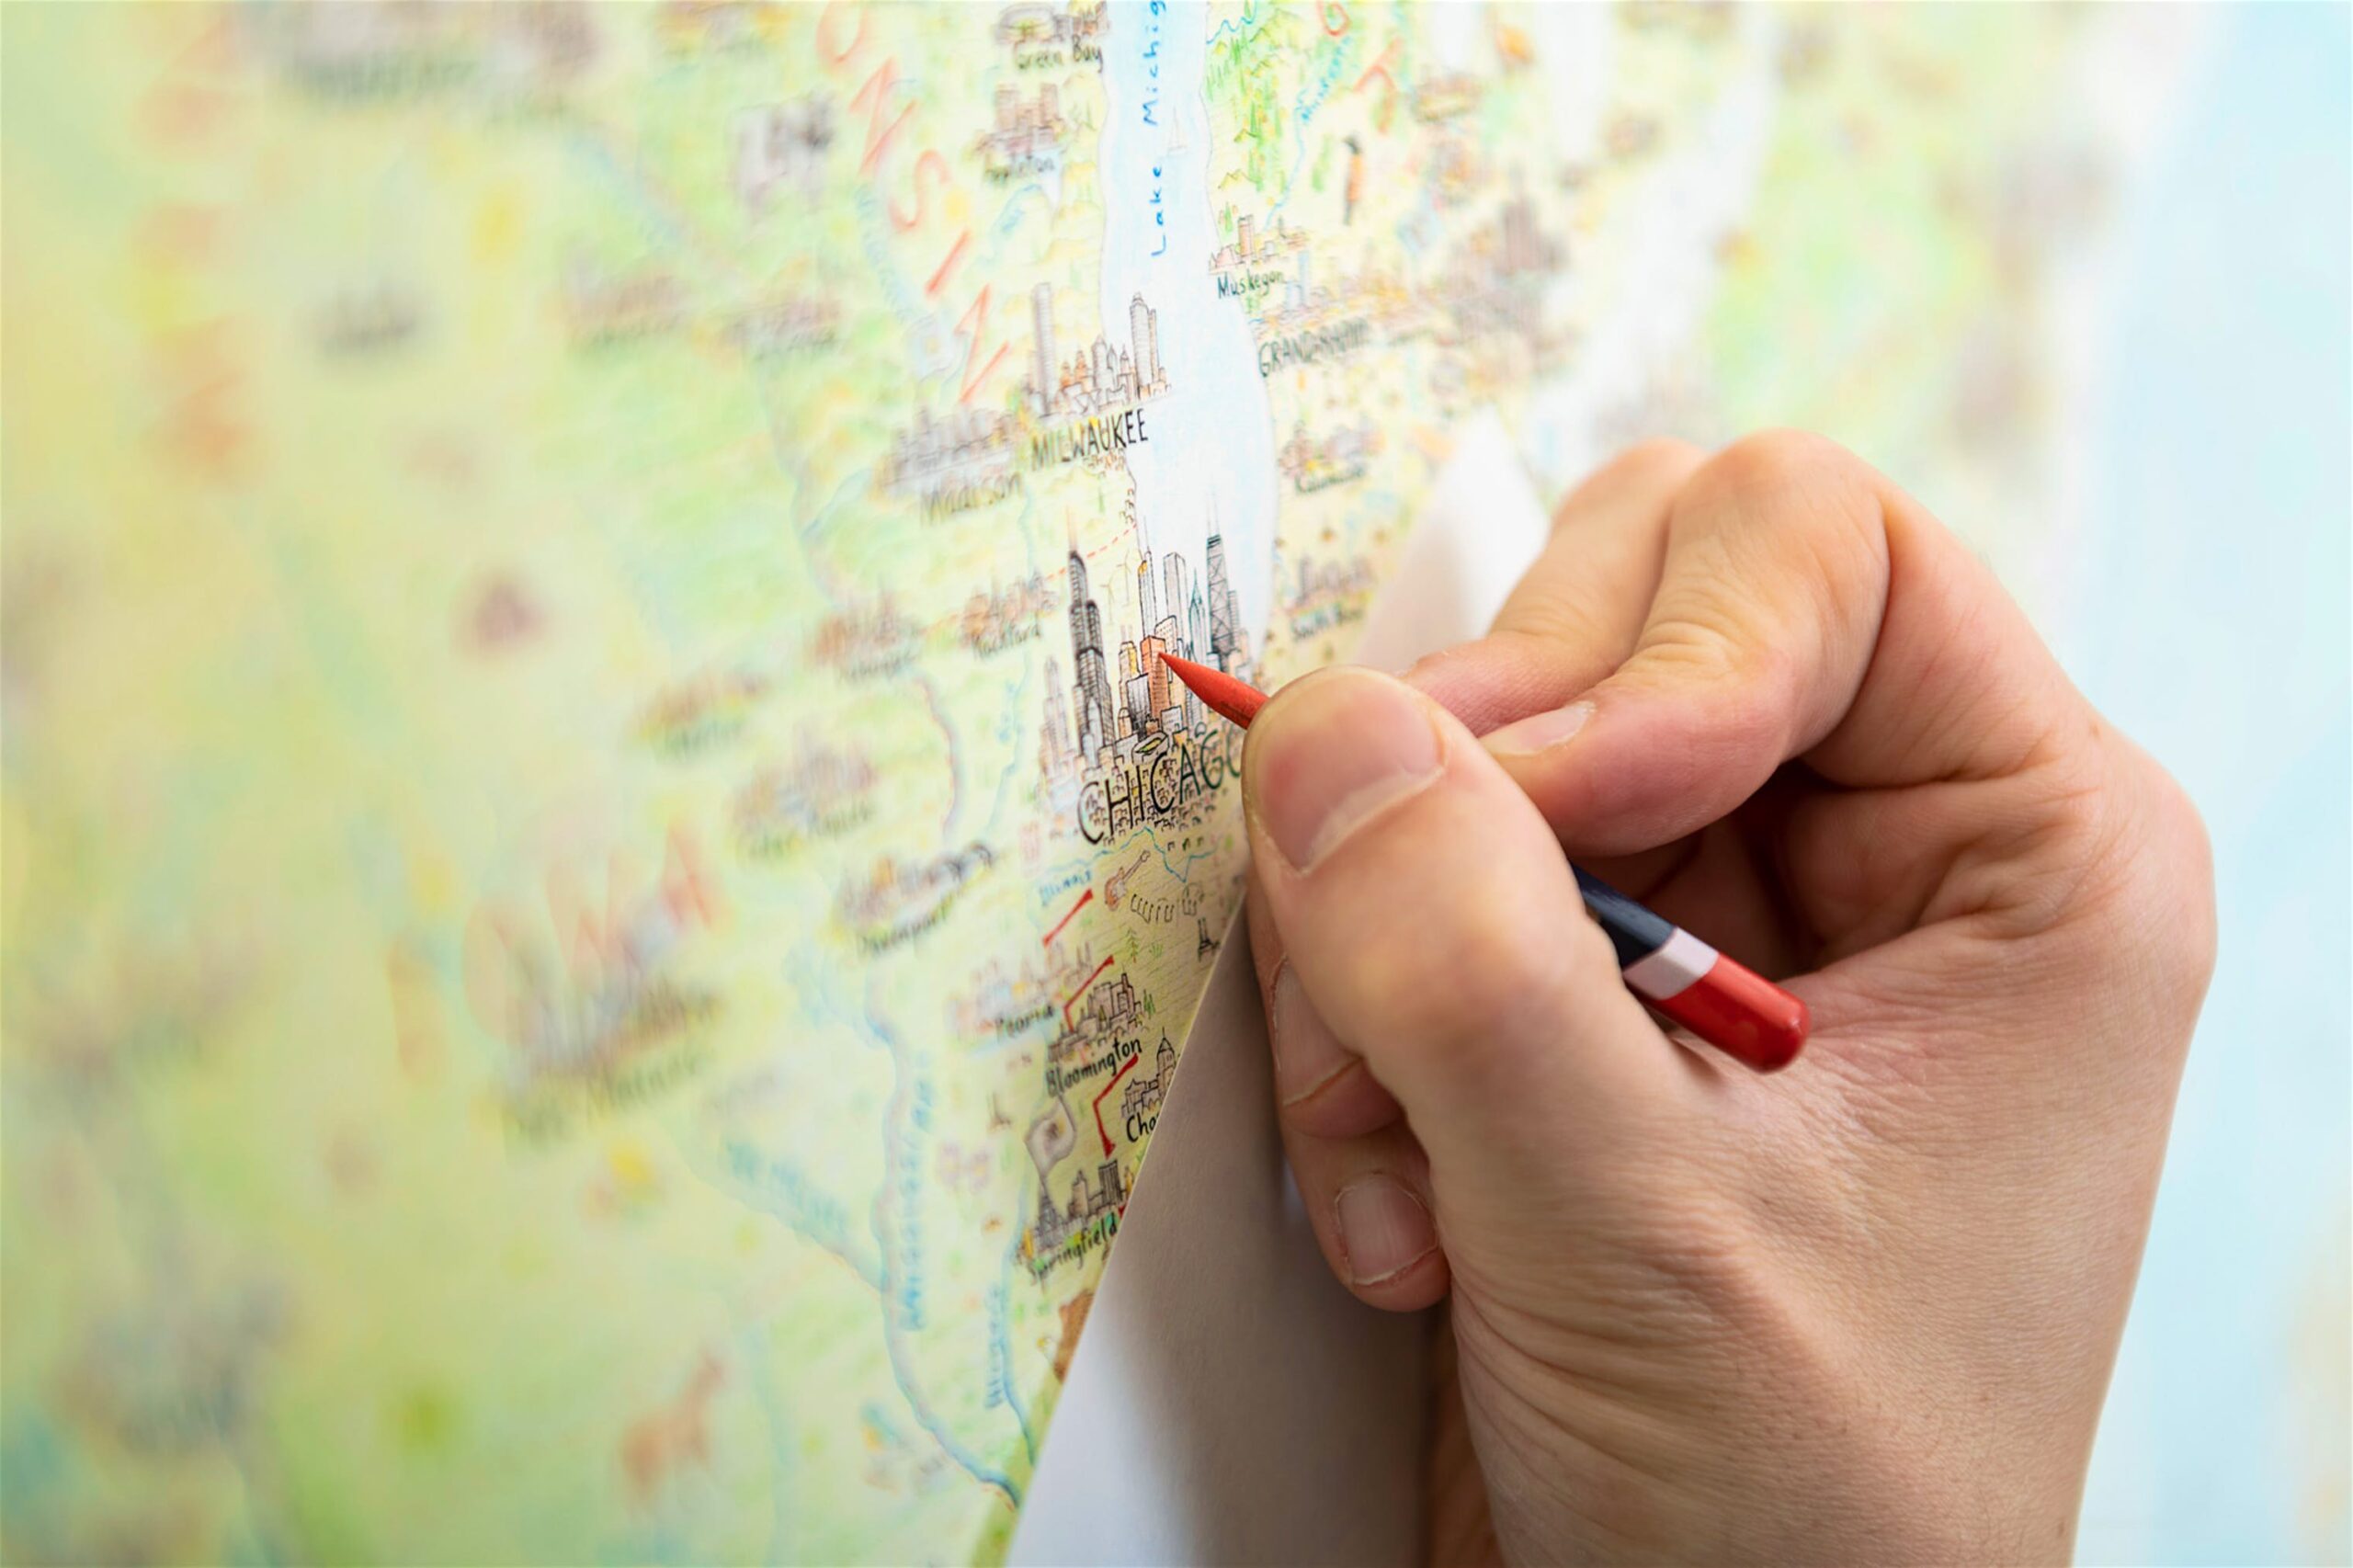
Image courtesy of: Lonely Planet
Thomas’ approach to mapmaking involves two aspects, the technical execution and the research. These two are not necessarily an exact split, they are certainly intertwined. Thomas drew from Nunavut’s Ellesmere Island in the Arctic to Mexico’s Yucatan tropical forests. Along the way, because he was not personally familiar with the area, Thomas drew everything with respect and patience realizing that it IS a real world that he is representing and that means real people and places.
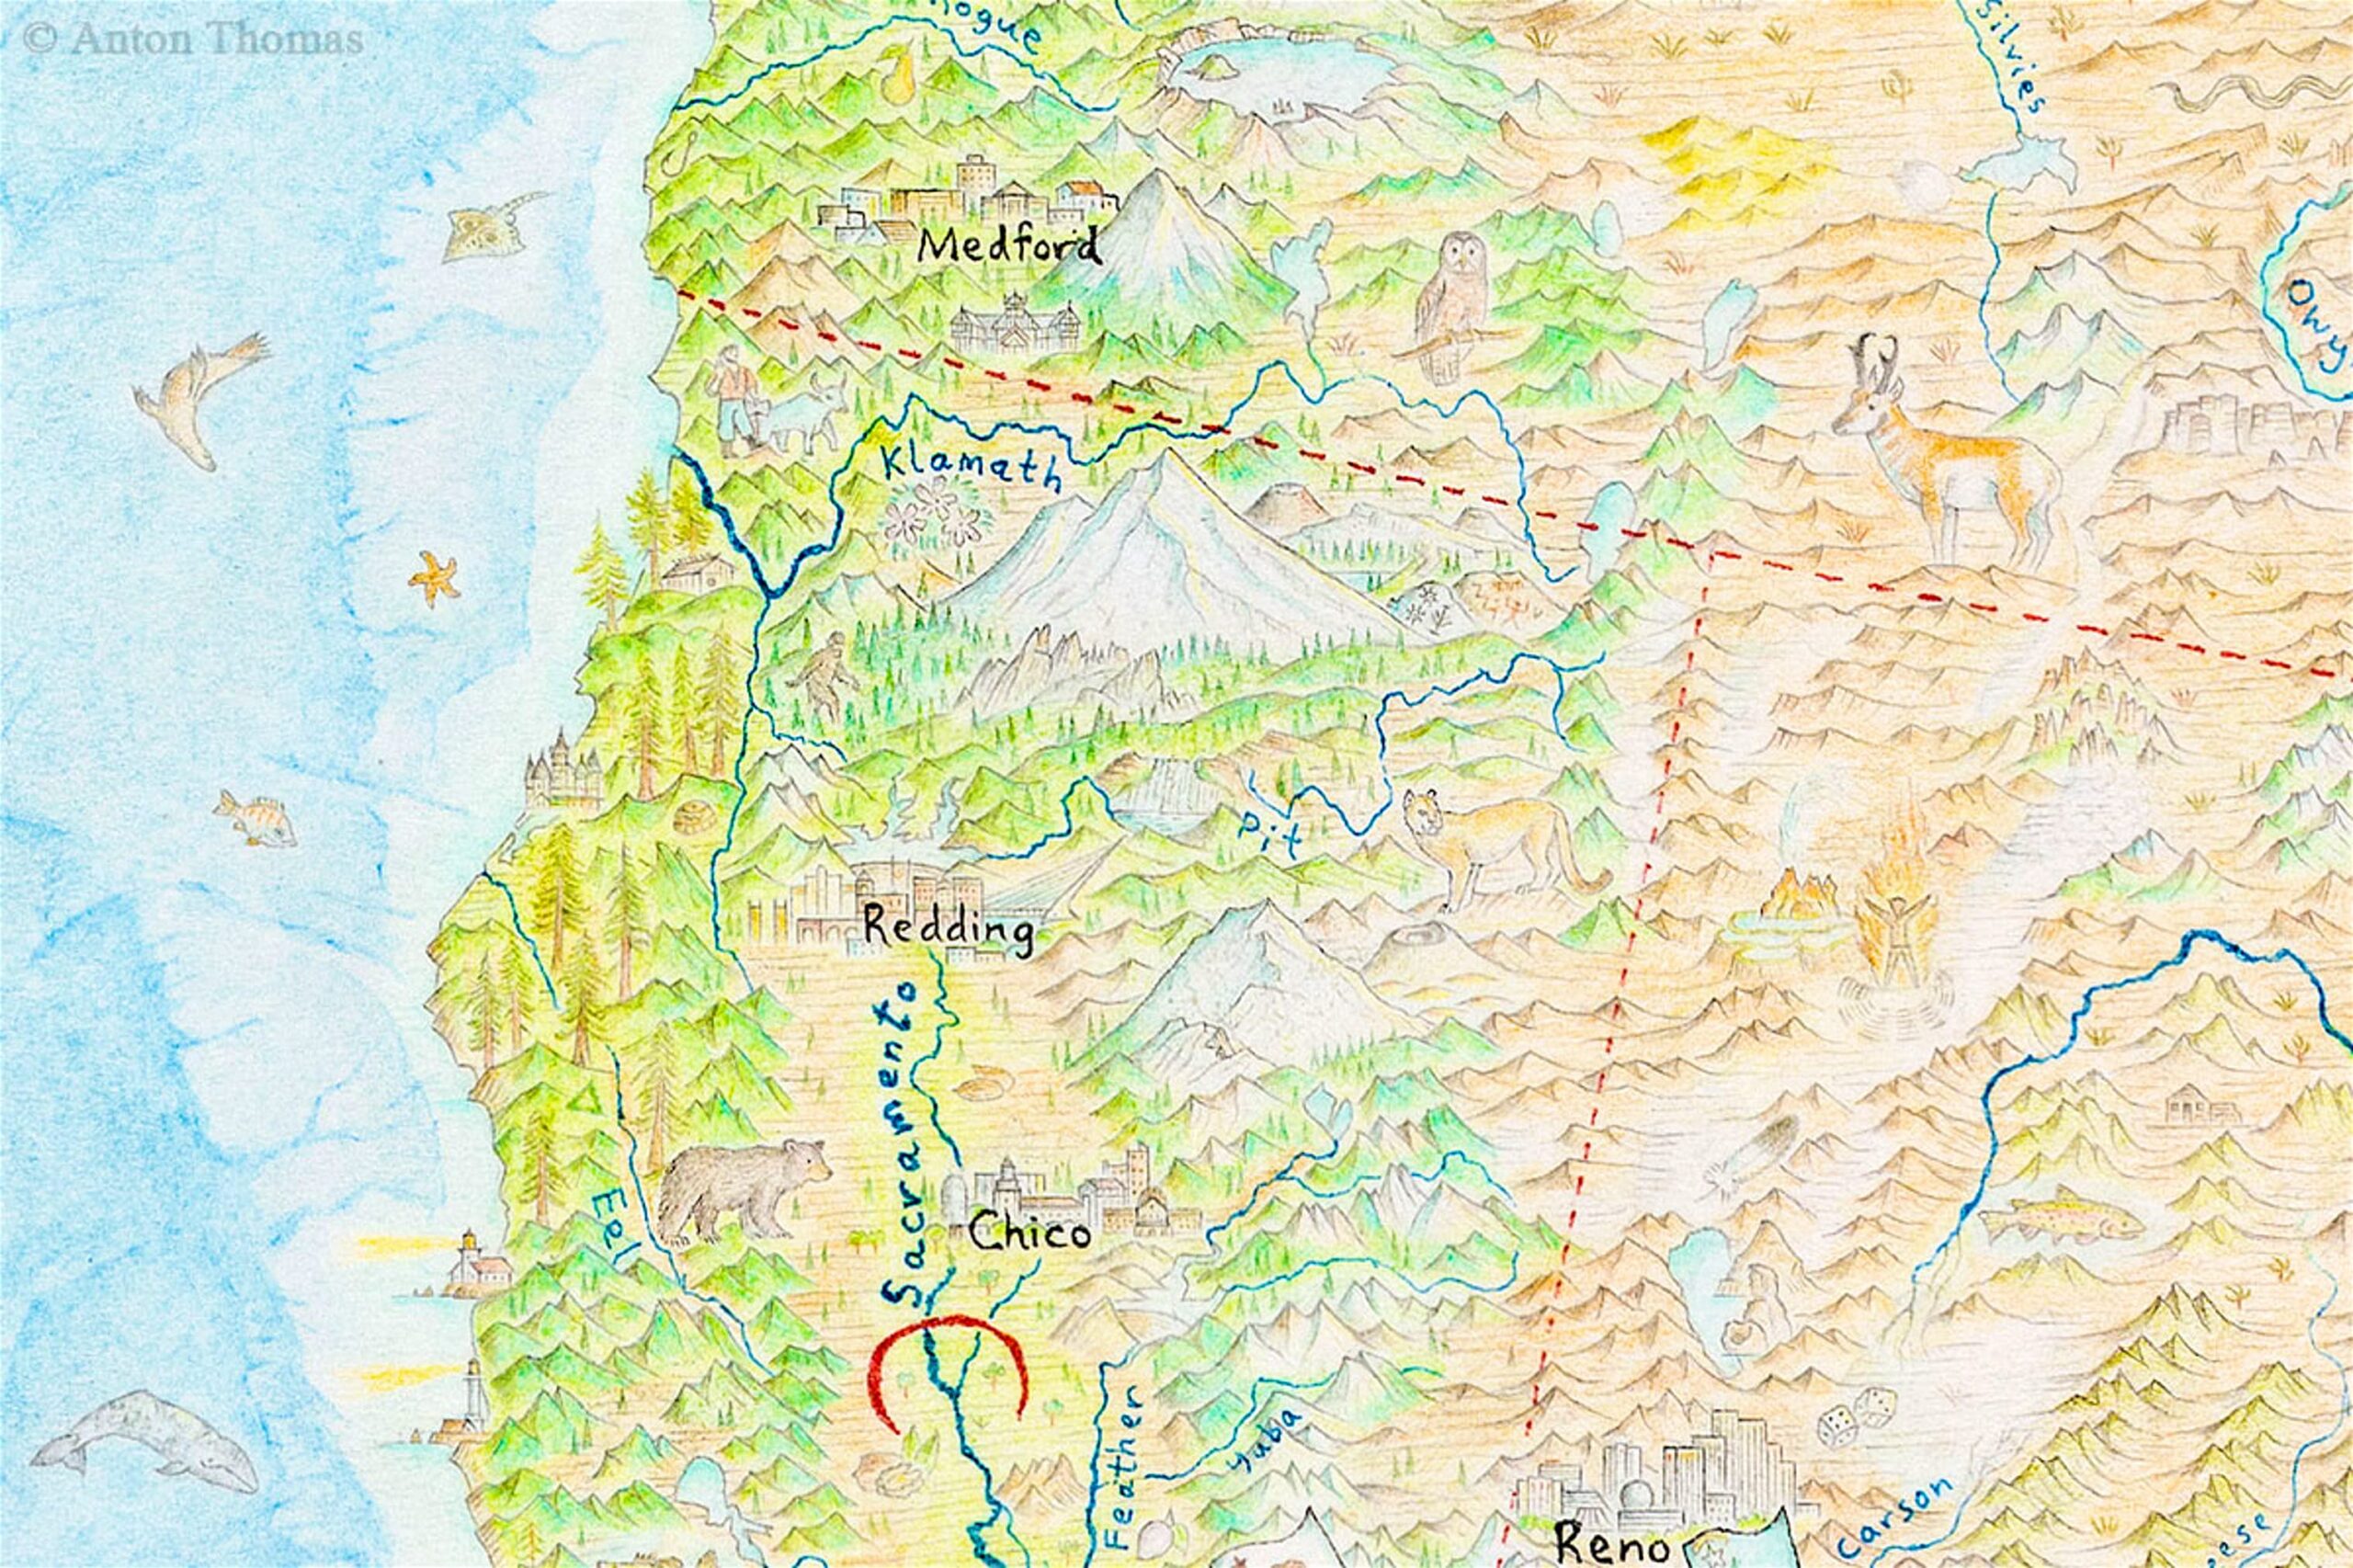
The 5′ x 4′ map sprawls across a single piece of paper… a testament to Thomas’ tenacity. One of his personal favorite details is the sasquatch he drew in California because he believes that urban legends are just as important to certain places as real people and animals.
Image courtesy of: Lonely Planet
Deciding what to leave off the map was a hard choice. The map includes 600 individual city skylines and thousands of details that help tell the story of each individual place. With the less populated areas such as everything south of “populated Canada”, Thomas’ metric was at least 100,000 people in a metropolitan statistical area. The metrics were good for him because they broke up certain hubs if there was enough geographical space between them.
As a self-taught cartographer without any formal art training, Thomas relied on peoples’ feedback to reflect upon his “geographical vision”. He believes that if a local tells him that he got something wrong, it is a lot more informative than if he sees something on Google Street View.
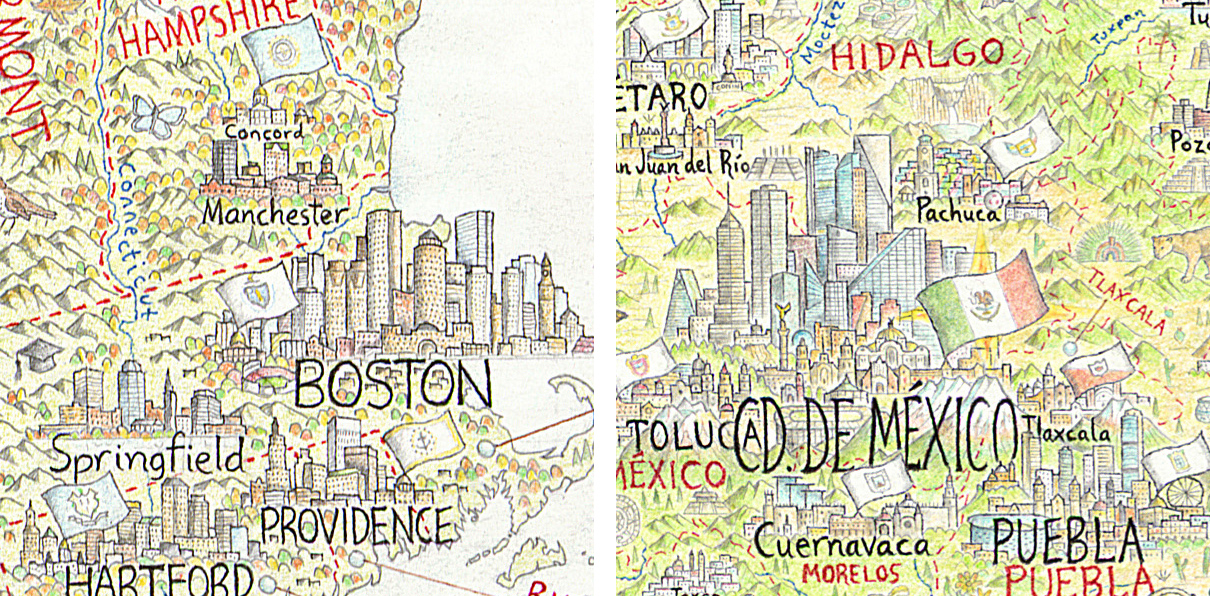
The capital cities of Boston and Mexico City.
Thomas estimates that he spent 35%-40% of his total time on research.
Image courtesy of: Zone One Arts
Unique in this map are the animals throughout; Thomas believes that they are residents of the land. For example, the grizzly bear in Montana is indicative of the area and helps people relate and remember that specific geographical space. Sometimes, he had extra space; for example around Kansas he drew a skunk. About the raccoon he drew in Arkansas, he says he got an e-mail from a gentleman who said, “I was sold the moment I saw that raccoon in Gillett, Arkansas, to commemorate our annual raccoon festival.” Interestingly, Thomas had no idea what he was talking about.
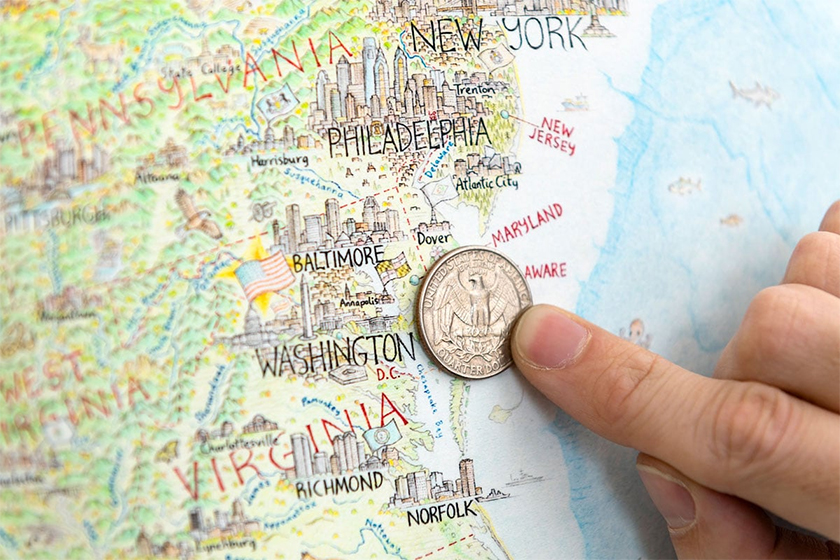
Image courtesy of: My Modern Met
